Types of Mean: Why "Average" Is Not One Thing
Arithmetic, geometric, harmonic, quadratic, weighted, and trimmed means explained — what each one preserves, where the plain average goes wrong, and how to pick the right mean for returns, rates, and real data.
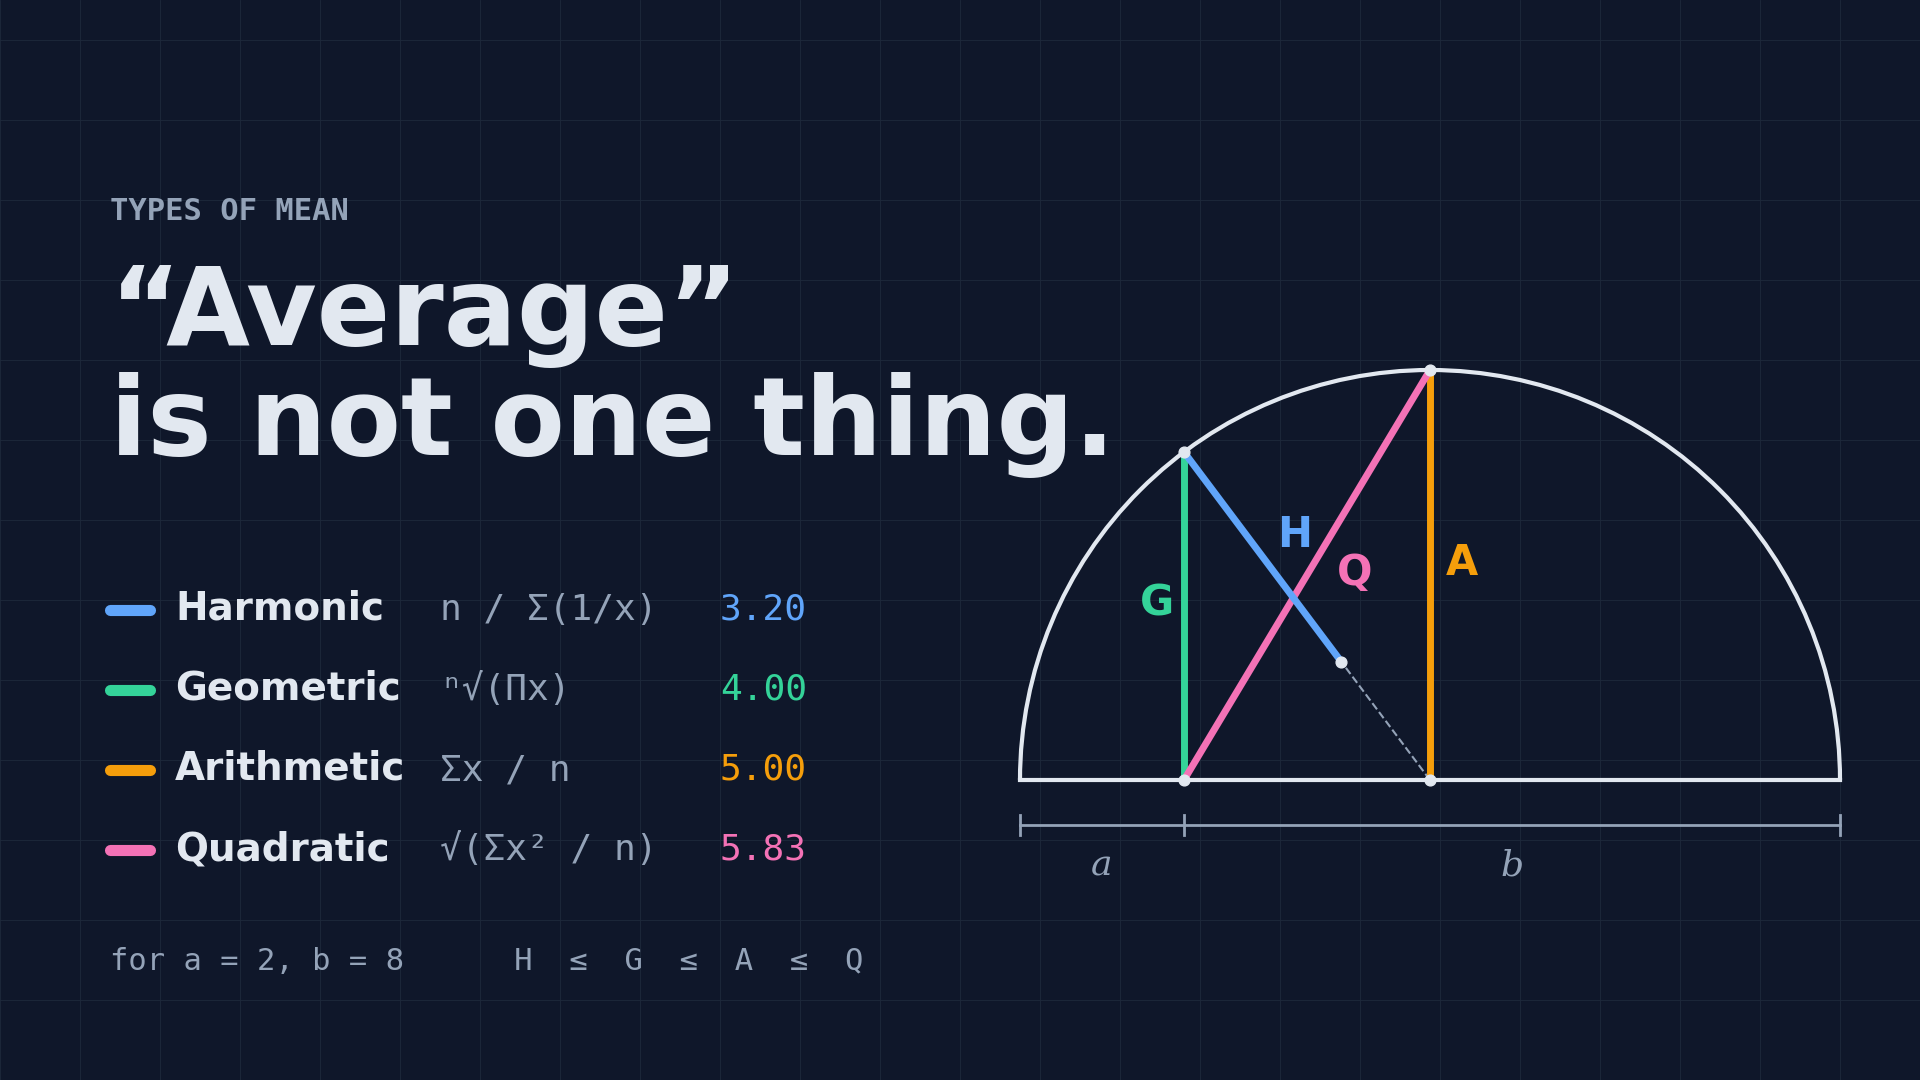
Types of Mean: Why "Average" Is Not One Thing
Ask someone for the average of a set of numbers and they'll add them up and divide. That works surprisingly often — and fails quietly in a lot of places that matter: investment returns, speeds, ratios, data with outliers. In each of those cases there's a different mean that gives the right answer.
This article covers the main types of mean, what question each one actually answers, and how to tell which one your problem needs. Short Python snippets are included so you can verify everything yourself.
What a Mean Is
A mean is a single number that stands in for a whole set of values. The trick is deciding what "stands in for" means. Every type of mean answers a slightly different version of the question:
If every value in the set were replaced by the same number, what number would preserve the thing I care about?
For the arithmetic mean, the thing preserved is the sum. For the geometric mean, it's the product. For the harmonic mean, it's the sum of reciprocals. Once you see it that way, choosing the right mean becomes a question of asking what you actually want to preserve.
1. Arithmetic Mean
The familiar one. Add everything up, divide by the count.
$$ \bar{x} = \frac{x_1 + x_2 + \dots + x_n}{n} $$
def arithmetic_mean(xs):
    return sum(xs) / len(xs)

arithmetic_mean([2, 4, 8])   # 4.667
What it preserves
The total. If five people earn $30k, $35k, $40k, $45k, and $50k, the arithmetic mean is $40k — and five people earning exactly $40k each would have the same combined payroll.
When to use it
- Values are additive: money, counts, heights, weights, test scores.
- Data is roughly symmetric without extreme outliers.
- You want the "center of mass" of the distribution.
Where it fails
Outliers. Add one person earning $5 million to the group above and the arithmetic mean jumps to about $866k — a number that describes nobody. This is why "average income" statistics are so often misleading and why the median is usually reported instead.
Multiplicative data. It gives wrong answers for growth rates, ratios, and anything that compounds. The next section shows why.
2. Geometric Mean
Multiply all the values together, then take the n-th root.
$$ G = \sqrt[n]{x_1 \cdot x_2 \cdots x_n} $$
import math

def geometric_mean(xs):
    return math.prod(xs) ** (1 / len(xs))

geometric_mean([2, 4, 8])   # 4.0
In practice, for large datasets, compute it via logarithms to avoid overflow:
def geometric_mean(xs):
    return math.exp(sum(math.log(x) for x in xs) / len(xs))
What it preserves
The product. Which makes it the correct mean for anything that compounds.
The classic example: investment returns
Say a portfolio returns +50% in year one and −50% in year two.
- Arithmetic mean: (50 + (−50)) / 2 = 0%. Sounds like you broke even.
- Reality: $100 → $150 → $75. You lost 25%.
The geometric mean gets it right. Work with growth factors (1.5 and 0.5):
geometric_mean([1.5, 0.5]) # 0.866 → an average return of −13.4% per year
And indeed, 0.866² ≈ 0.75. Two years of −13.4% gets you to $75. That's the real average annual return.
When to use it
- Growth rates, interest rates, returns on investment (this is what "CAGR" is).
- Ratios and percentages that multiply: year-over-year changes, scaling factors.
- Comparing things measured on very different scales (benchmark scores, index construction).
- Any time the data is log-normally distributed — right-skewed, all positive, spanning orders of magnitude.
Constraints
- All values must be positive. A zero makes the product zero; a negative makes the root undefined.
- It's always ≤ the arithmetic mean (equal only when all values are identical). This is the famous AM–GM inequality.
3. Harmonic Mean
The reciprocal of the arithmetic mean of the reciprocals.
$$ H = \frac{n}{\frac{1}{x_1} + \frac{1}{x_2} + \dots + \frac{1}{x_n}} $$
def harmonic_mean(xs):
    return len(xs) / sum(1 / x for x in xs)

harmonic_mean([2, 4, 8])   # 3.429
What it preserves
The sum of reciprocals. It's the right mean for rates — anything expressed as "X per Y" where the Y (the denominator) is what you're holding fixed.
The classic example: average speed
You drive 60 km to a city at 60 km/h and drive back at 30 km/h. What was your average speed?
- Arithmetic mean: (60 + 30) / 2 = 45 km/h. Wrong.
- Reality: 60 km at 60 km/h takes 1 hour. 60 km at 30 km/h takes 2 hours. Total: 120 km in 3 hours = 40 km/h.
harmonic_mean([60, 30]) # 40.0
The harmonic mean is right because the distance was fixed and the time varied. If instead you'd driven for one hour at each speed (time fixed, distance varied), the arithmetic mean would have been correct. Which denominator is fixed decides which mean to use.
When to use it
- Averaging rates where the numerator is fixed: speed over fixed distances, price-to-earnings ratios, throughput per task.
- The F1 score in machine learning is the harmonic mean of precision and recall — chosen deliberately because it punishes a large gap between the two.
- Parallel resistors in electronics, combined work rates ("if A finishes in 3 hours and B in 6, together they finish in...").
Constraints
- All values must be positive and nonzero.
- It's always the smallest of the three Pythagorean means: H ≤ G ≤ A.
- It's heavily pulled toward the smallest value — which is exactly why F1 uses it.
4. Quadratic Mean (Root Mean Square)
Square every value, average the squares, take the square root.
$$ Q = \sqrt{\frac{x_1^2 + x_2^2 + \dots + x_n^2}{n}} $$
def rms(xs):
    return math.sqrt(sum(x * x for x in xs) / len(xs))

rms([2, 4, 8])   # 5.292
What it preserves
The sum of squares — which usually means energy or magnitude regardless of sign.
When to use it
- Values that can be positive or negative and you care about their size, not their direction. An alternating current swings between +325V and −325V; its arithmetic mean is zero, which is useless. Its RMS is 230V — the number on your wall socket.
- Measuring error: RMSE (root mean square error) is the standard way to score predictions, because squaring makes every error positive and penalizes large misses more than small ones.
- Physics: the RMS speed of gas molecules, signal amplitude, vibration.
Constraints
- Always ≥ the arithmetic mean. The full ordering is H ≤ G ≤ A ≤ Q.
5. Weighted Mean
Not every value deserves equal say. A weighted mean multiplies each value by a weight before averaging.
$$ \bar{x}_w = \frac{w_1 x_1 + w_2 x_2 + \dots + w_n x_n}{w_1 + w_2 + \dots + w_n} $$
def weighted_mean(xs, ws):
    return sum(x * w for x, w in zip(xs, ws)) / sum(ws)

# Grades: homework 80 (weight 20%), midterm 70 (30%), final 90 (50%)
weighted_mean([80, 70, 90], [0.2, 0.3, 0.5])   # 82.0
When to use it
- Grades with components of different importance.
- GPA: each course grade weighted by its credit hours.
- Combining groups of different sizes. If class A (30 students) averaged 70 and class B (10 students) averaged 90, the school-wide average is not 80 — it's the weighted mean, 75.
- Portfolio returns, where each asset's return is weighted by how much of the portfolio it makes up.
- Survey data, where responses are weighted to correct for over- or under-sampled groups.
Any of the other means can be weighted too. A weighted geometric mean is the basis of most price indexes; a weighted harmonic mean is used for average P/E ratios of a fund.
6. Trimmed and Winsorized Means
Both are defenses against outliers while keeping an arithmetic-style mean.
Trimmed mean: drop the lowest and highest k% of values, then take the arithmetic mean of what remains.
def trimmed_mean(xs, trim=0.1):
    xs = sorted(xs)
    k = int(len(xs) * trim)
    return arithmetic_mean(xs[k : len(xs) - k])

trimmed_mean([1, 2, 3, 4, 5, 6, 7, 8, 9, 100], trim=0.1)   # 5.5 (dropped 1 and 100)
Winsorized mean: instead of dropping the extremes, clamp them to the nearest kept value, then average.
def winsorized_mean(xs, trim=0.1):
    xs = sorted(xs)
    k = int(len(xs) * trim)
    low, high = xs[k], xs[-k - 1]
    return arithmetic_mean([min(max(x, low), high) for x in xs])
When to use them
- Judging in sports like gymnastics and diving (drop the highest and lowest score).
- Economic statistics where a few extreme values would swamp the picture.
- Any dataset where you expect a handful of errors or wild outliers but still want a mean rather than a median.
The median is the extreme case: a 50% trimmed mean.
7. The Generalized (Power) Mean
The arithmetic, geometric, harmonic, and quadratic means are all members of a single family, controlled by one parameter p:
$$ M_p = \left( \frac{1}{n} \sum_{i=1}^{n} x_i^p \right)^{1/p} $$
| p | Mean |
|---|---|
| −∞ | Minimum |
| −1 | Harmonic |
| 0 (limit) | Geometric |
| 1 | Arithmetic |
| 2 | Quadratic (RMS) |
| 3 | Cubic |
| +∞ | Maximum |
def power_mean(xs, p):
    if p == 0:
        return geometric_mean(xs)
    return (sum(x ** p for x in xs) / len(xs)) ** (1 / p)
As p increases, the mean is pulled more toward the large values; as it decreases, toward the small ones. This is a useful mental model: picking a mean is really picking how much influence you want the extremes to have.
Comparison at a Glance
Using the set {2, 4, 8} throughout:
| Mean | Formula idea | Result | Preserves | Typical use |
|---|---|---|---|---|
| Harmonic | n / Σ(1/x) | 3.43 | Sum of reciprocals | Rates, speeds, F1 score |
| Geometric | ⁿ√(Πx) | 4.00 | Product | Growth, returns, ratios |
| Arithmetic | Σx / n | 4.67 | Sum | Additive quantities |
| Quadratic (RMS) | √(Σx² / n) | 5.29 | Sum of squares | Signals, errors, magnitudes |
| Weighted | Σwx / Σw | varies | Weighted sum | Grades, GPA, mixed groups |
| Trimmed | mean of middle values | varies | Sum (outliers removed) | Judging, robust stats |
Note the ordering: harmonic < geometric < arithmetic < quadratic. It holds for any set of positive numbers.
How to Choose
Ask these in order:
- Can the values be negative, and do I care about magnitude? → RMS.
- Do the values compound or multiply? (growth rates, returns, ratios) → Geometric.
- Are they rates with a fixed numerator? (speed over fixed distance, per-unit costs) → Harmonic.
- Do some values matter more than others? → Weighted (version of whichever mean fits above).
- Are there outliers I don't trust? → Trimmed mean, or just use the median.
- None of the above? → Arithmetic. It's the default for a reason.
Summary
"The average" is a choice, not a fact. The arithmetic mean preserves totals, the geometric mean preserves products, the harmonic mean preserves rates, and the quadratic mean preserves energy. Weighting and trimming adjust any of them for importance and outliers.
The practical skill is pausing before you divide by n and asking: what am I actually trying to preserve? Get that right and the rest is arithmetic — or geometric, or harmonic.